
Mapping Economic Change in New York City’s Telecom Industry
NYU CUSP Capstone Project 2020
NYU CUSP Capstone Project 2020
New York City's 2020 Internet Master Plan found that there are 1.5 million New Yorkers who do not have any means to connect online. And as the COVID-19 pandemic highlighted, a reliable broadband internet connection is increasingly becoming crucial utility for New Yorkers' economic well-being. For these reasons, New York City's Department of Information Technology and Telecommunications (DoITT) wants to understand if the current telecommunication industry regulations are effective at generating a competitive industry environment that can provide cheap and reliable internet access to all New Yorkers.
The team set out to discover if there is an optimal number of ISPs for the New York City market that would improve Internet accessibility in terms of coverage area, household adoption rates, and affordability for all New Yorkers. The aim is to produce a policy white paper that explains NYC’s broadband market structure, the factors influencing availability of broadband internet and subscription rates, and how DoITT can optimize the regulatory framework.

Source for pricing information for both land and mobile internet service offered per company at the borough level.

Survey containing the internet service providers (ISPs) that are found within each Census block, the type of infrastructure (e.g. fiber, cable) used to deliver internet service, and their maximum advertized internet speeds.

The ACS contains demographic information such as race, income, and age, and broadband internet subscription rates, all at the Census tract level.
Neighborhood Tabulation Areas (NTAs) shapefiles, Census block shapefiles,
and locations of telecommunications infrastructure were used enrich our analysis of NYC.
We also referenced NYC's Internet Master Plan for guidance.
A linear regression was utilized to understand the demand and supply relationship in the NYC telecom industry. The model uses data from 2017-2019 of all 2165 NYC census tracts. The dependent variable we're predicting is the price of broadband service (P).
For the demand side, independent variables include: number of ISPs, subscription rate, race, age, and borough.
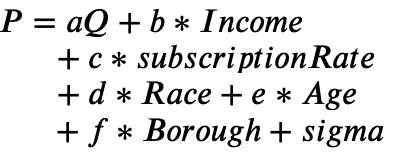
For the supply side, the only independent variable is the number of broadband service providers in each Census tract (Q).

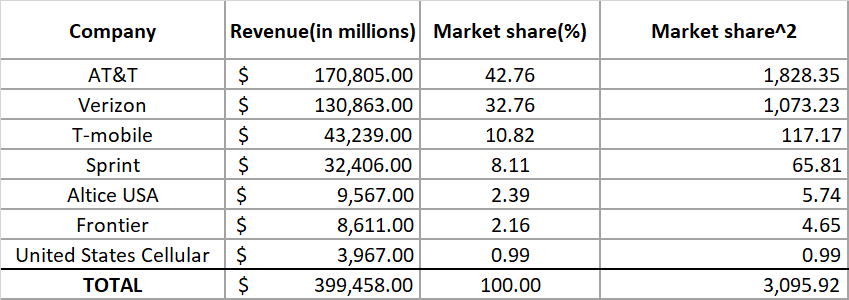
The Herfindahl-Hirschman Index (HHI) was used to estimate the concentration level of the broadband market in New York City.
This measure is commonly used by the Department of Justice to determine firm-market concentration and competitiveness.
The HHI was calculated by taking the sum of the square of each internet firm’s market share,
taking into account the relative size distribution of each firm.
The number will increase when more companies emerge in a market or the disparity in size between those firms decreases.
However, this method fails to assess the complexities of various markets in a more accurate way.

Currently only two thirds of NYC households have access to a wired broadband connection.
We created this dashboard to appreciate in red the Census tracts with broadband internet
adoption rates lower than 66% (i.e. two-thirds).
Visually we can see that the Bronx as a whole struggles with low adoption rates,
whereas the other boroughs have smaller more concentrated hotspots like in Williamsburg,
the Lower East Side, and Borough Park.
Additionally, to add more color to this visualization, it includes information about
income rates and the number of unique internet
service providers (ISPs) found in eacn Census tract.
As we can discover through the dashboard, areas with the most disparaties in broadband
subscription (Wired Broadband < 0.66) come from areas with low income (00-50k> 0.50),
while the number of ISPs don't seem to have much of an impact on
broadband adoption rates.
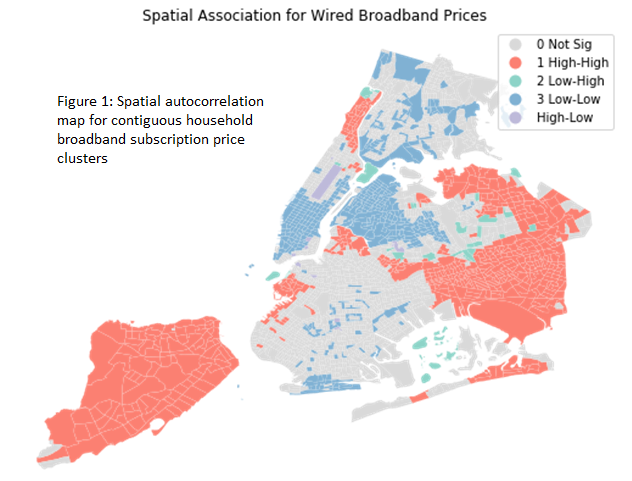
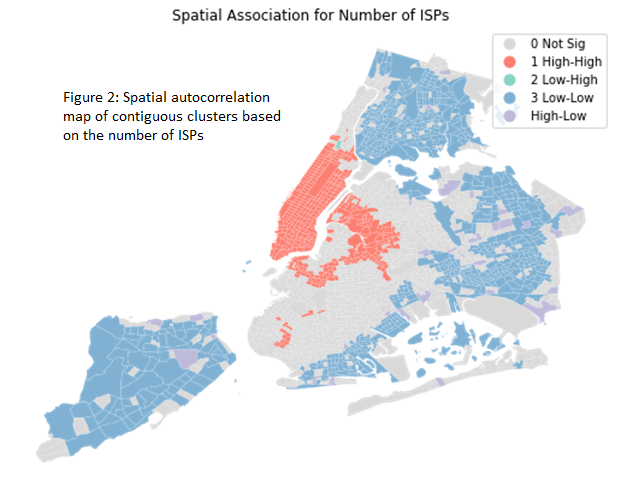
At the scale of census tracts, internet service infrastructure displays strong signs of spatial autocorrelation. There are clusters of spatially contiguous census tracts that share similar levels of infrastructural provision in terms of price and the number of ISPs that is beyond randomness.
It is more likely than not that these spatial patterns seen in Figures 1 and 2 are not
randomized outcomes.
The broad swathes of contiguous census tracts that are similarly clustered together
imply that there are network
effects at a scale greater than census tracts.
Here's a legend explaining the assigned values on our figures below:
Much like the Pricing Regression results of the supply and demand of ISPs, the Spatial
Regressions showed that
income levels were significant variables in determining broadband subscription rates.
Census tracts with more wealthier residents are associated with higher subscription rates.
More interestingly, the number of ISPs was negatively correlated with subscription rates.
These findings might imply that in the long-run, an increase in the number of ISPs can
result in market
fragmentation that reduces subscription rates.
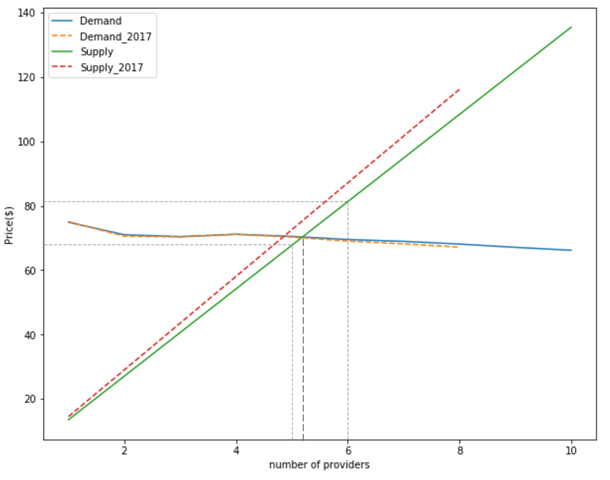
The pricing regression identified a significant negative correlation in the demand side,
and a significant positive correlation in the supply side.
These result agree with microeconomic theory that states that higher prices for a good leads
to
fewer people consuming it.
Furthermore the results showed that race and borough were factors of significant influence
on the price
of broadband internet.
By combining the demand and supply curves calculated using the regression results, we found the market equilibrium to be around 5 broadband providers, while the equilibrium price is around $70 per month.
In NYC the Herfindahl-Hirschman Index score for the telecoms industry is of 3,096.
Following the guidance of the U.S. Department of Justice & Federal Trade Commission,
the NYC telecom market crosses the 2,500 threshold to classify it as an oligopolistic
market.
Therefore, the NYC telecom industry is considered an oligopolistic market.
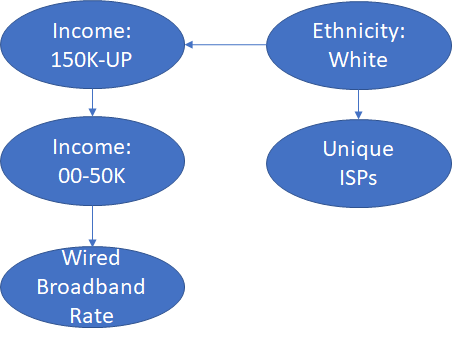
The Bayes Net results are in line with our other analysis: that broadband internet
subscription rates
are a function of income.
The network identified that neighborhoods with greater numbers of white residents tend to be
richer and have
more unique ISPs. Conversely, areas with less people making more than 150K tend to have more
people making below 50K per year.
It is these poorer Census tracts that also have the lowest rates of Wired Broadband rates.
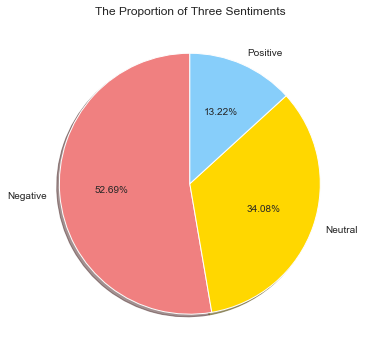
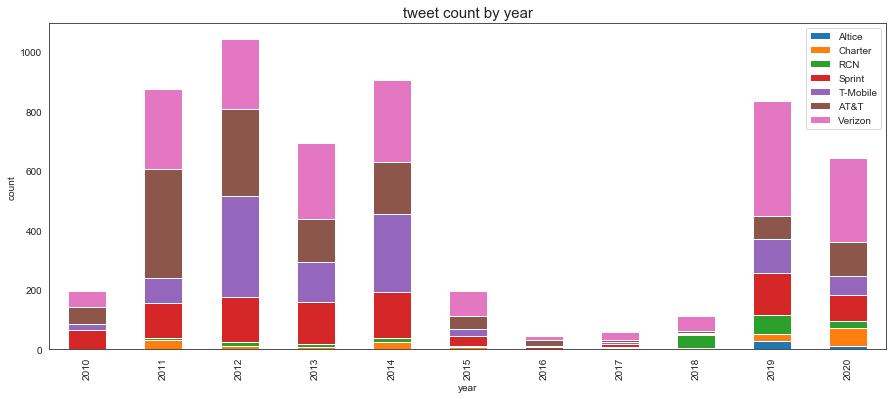
Sentiment analysis (as pictured below) determined that more than half of all the collected tweets were negative (e.g. complaints). This indicates that in most cases users tweet about their ISP when there is a problem with their service.
On a provider level across time, tweet sentiment grew positive (towards value of 1) between 2013 and 2018, and then decreased between 2018 and 2020. This indicates that between 2015 and 2018, consumers may have been more satisfied with their service, as they tweeted less about it.
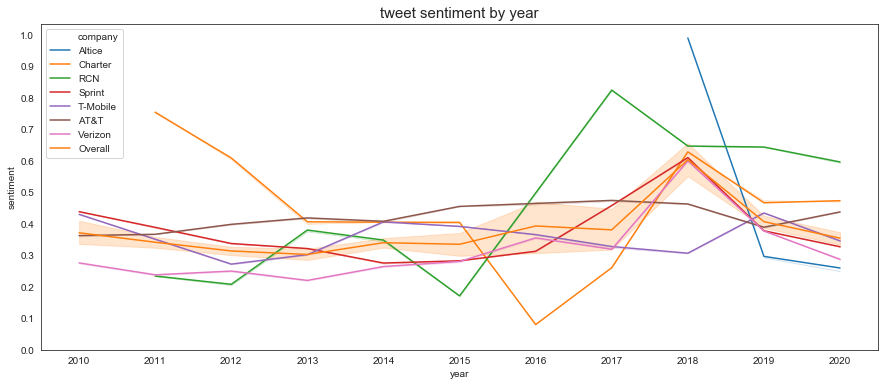
However there were fewer tweets between 2015 and 2018 as compared to other years. Verizon, AT&T, T-Mobile, & Sprint accounted for a vast majority of the tweets collected.
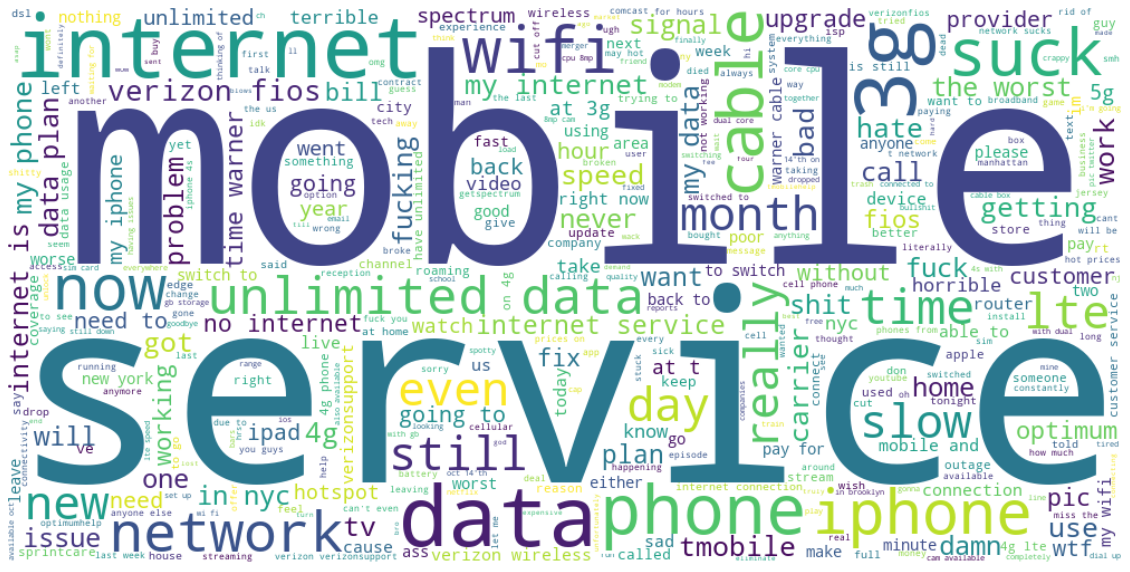
Considering the tweets which display extremely negative sentiment, the word cloud below
shows what words are
commonly used in these tweets.
Mobile service is the most commonly mentioned kerword/phrase in negative tweets.
Some of the other significant keywords (e.g. internet, data, wifi, cable, network, speed,
3g, signal, LTE, slow) show that most people
complained about the performance aspect of their internet service (connectivity,
accessibility, speed).
This could be a symptom of the oligopolistic market, where companies do not have enough
incentive to maintain high internet service quality.
These result suggests that government agencies and public policy should not only focus on the quantity of providers in NYC but also on how to address service quality.